This is a very short guide to ECG interpretation. This article will focus on to quickly enable you to read ECG strips, and not an in-depth understanding of the ECG. It's targeted for the people who are new to ECG and are willing to make a jump-start at reading ECG before studying it further in more detail.
You can get the most out of this article if you have some idea about the anatomy and the physiology of the heart.
The article will start with a few basic things about ECG, and then proceed to a step by step guide to read and interpret an ECG strip.
The Basics
There are 4 basic things you need to know about to understand ECG—
The Leads
The leads collect electrical information from the skin of the subject. Usually ECG is done with 12 leads, of them 3 are limb leads, 3 are augmented limb leads and 6 are chest leads.
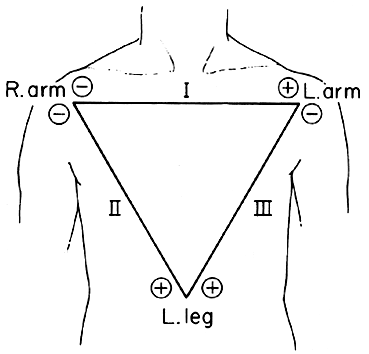
Limb Leads
| Lead name | Lead position |
|---|---|
| Lead I | Right Arm |
| Lead II | Left Arm |
| Lead III | Left Foot |
A neutral lead is also positioned at the right foot.
Augmented Limb Leads
- Lead aVR
- Lead aVL
- Lead aVF
Chest Leads
| Lead name | Lead position |
|---|---|
| Lead V1 | 4th intercostal space, right side of sternum |
| Lead V2 | 2nd intercostal space, left side of sternum |
| Lead V3 | Midway between lead V2 and lead V4 |
| Lead V4 | 5th intercostal space, mid-clavicular line |
| Lead V5 | 5th intercostal space, anterior-axillary line |
| Lead V6 | 5th intercostal space, mid-axillary line |
Views of the Heart
There are four different views of heart that helps to identify the location of an abnormal reading.
Every view is best appreciated by a specific set of leads. They are also called lead groups
| View | Leads |
|---|---|
| Anterior | V2, V3, V4 |
| Left lateral | I, aVL, V5, V6 |
| Inferior | II, III, aVF |
| Right ventricular | aVR, V1 |
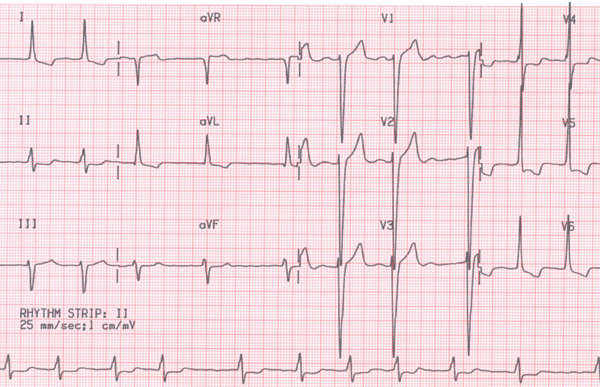
ECG strip
ECG strip is composed of 1 cm × 1 cm cells. Every line at the gap of such 5 cells (5 cm) is drawn in thick line.
ECG has a paper speed of 25 cm/second, so a small cell of ECG measures 0.04 second horizontally (so every large cell equals 0.2 second).
ECG strip plots voltage vertically. Each small cell represents 0.1 mV vertically (so every large cell equals 0.5 mV).
There are usually 12 plottings representing 12 leads and one long lead II for better inspection of the rate and rhythm.
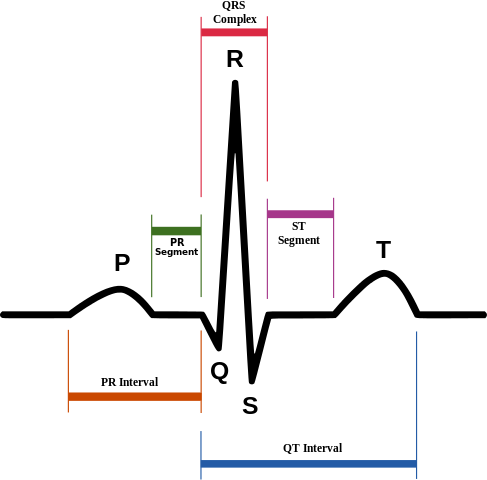
Waves and intervals
Normally the heart is depolarized from SA node at the right atrium (depolarizing both atria) and after passing through AV node the depolarization continues to the ventricles (through Bundle of His and Purkinje fibers). The repolarization occurs in the same direction.
When a wave comes towards a lead, it registers a positive deflection (upward curve on paper) and when a wave goes away from it, it registers a negative deflection (downward curve on paper). When a wave travels parallel to a lead, it registers a biphasic curve.
An interval is the time between the start of the previous wave and the start of the following wave, whereas a segment is the time between the end of the previous wave and the start of the following wave.
The important waves and intervals and their relations to cardiac physiology is mentioned below.
| ECG feature | Physiology | Normal duration |
|---|---|---|
| P wave | Atrial depolarization | < 0.08 second (2 small cells) |
| PR interval | AV nodal delay | 0.12 - 0.2 second (3 - 5 small cells) |
| QRS complex | Ventricular depolarization | 0.08 - 0.12 second (2 - 3 small cells) |
| ST segment | Time between ventricular depolarization and ventricular repolarization | |
| T wave | Ventricular repolarization |
The atrial depolarization coincides with ventricular repolarization, so it's hidden within the QRS complex and can't be detected.
Reading ECG
You can easily read ECG strip by following the 10 steps described below—
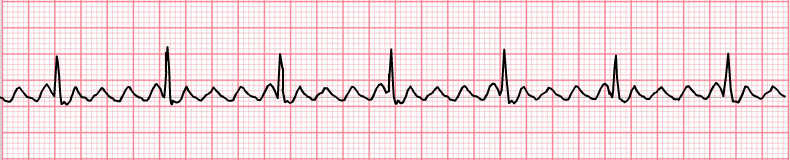
Heart Rate
The heart rate is best determined by looking at the long lead II. It can be calculated by the following procedure:
Find the R-R interval: First find two consecutive QRS complex. Now count the number of cells (small cell for precision or large cell for ease of calculation) between the tip of the two consecutive R waves.
`"Heart Rate" = 300 / "R-R interval in large cells"`
or
`"Heart Rate" = 1500 / "R-R interval in small cells"`
If you find bradycardia or tachycardia, the next thing to look for would be arrhythmias.
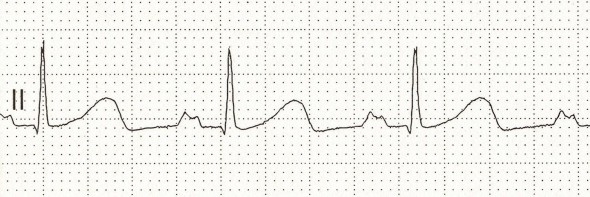
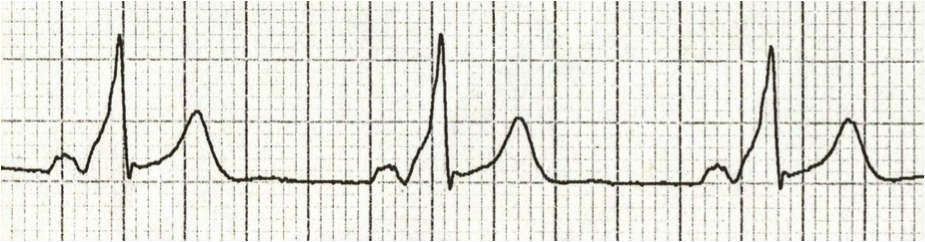
Example
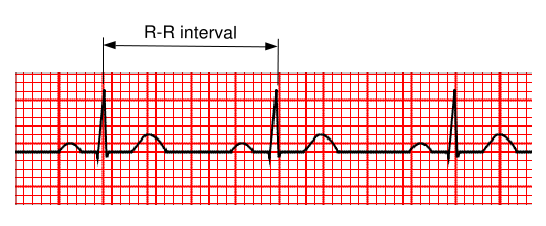
In this figure the R-R interval is 20 small cells or 4 large cells
So the heart rate is—
`1500 / 20 = 75 // "min"` or `300 / 4 = 75 // "min"`
Atrial Rate
Atrial rate is measured by the same method, except R-R interval is replaced by P-P interval.
`"Atrial Rate" = 300 / "P-P interval in large cells"`
or
`"Atrial Rate" = "1500" / "P-P interval in small cells"`
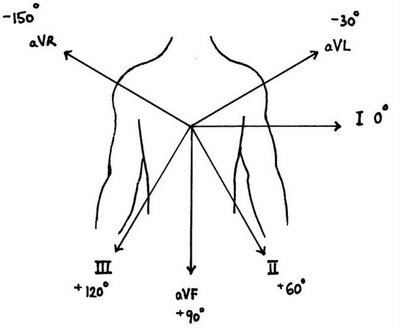
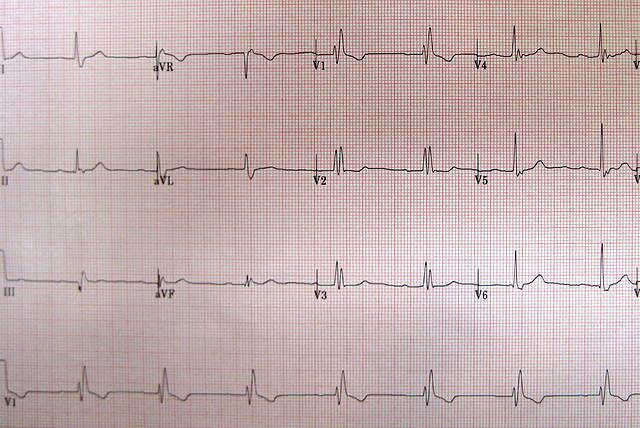
Cardiac Axis
Cardiac axis is the direction in which the depolarization wave travels within the cardiac electrophysiological circuit. Normally the axis is downwards and leftwards. We already know that if a wave is moving towards a lead it will show an upward curve (+), if away from it it will show a downward curve (-).
The most important leads to determine the cardiac axis is Lead I and Lead aVF. The following table illustrates it—
| Lead I | Lead aVF | Axis |
|---|---|---|
| (+) | (+) | Normal |
| (+) | (-) | Left axis deviation |
| (-) | (+) | Right axis deviation |
| (-) | (-) | Extreme right axis deviation |
In case of axis deviation look for cardiac hypertrophy, conduction blocks.
Example
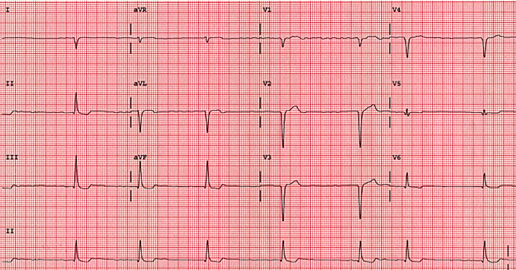
In the above picture the lead I shows negative deflection and the lead aVF shows positive deflection. So it is a case of right axis deviation.
For more precise estimation of cardiac axis: Find the limb lead with the closest biphasic curve i.e. almost equal negative and positive deflection in QRS complex. The cardiac axis lies almost perpendicularly to this lead. For example in the above figure the most biphasic limb lead is aVR (-150°), so the cardiac axis lies close to either -60° or +120°. But since we already know that it is a right axis deviation from lead I (-ve) and aVF (+ve), we can conclude that the cardiac axis is close to +120°. (Note that normal cardiac axis may range from -30° to +90°)
Atrial axis: Cardiac axis and the ventricular axis is the same. Similarly an Atrial axis can be determined. It is done by the same method using P wave in lead I and aVF.
Intervals
Most important intervals are PR interval, QT interval and the width of QRS complex. The normal values have already been discussed. Any shortening or lengthening of these values may be clinically significant.
- Long PR interval: look for heart blocks.
- Short PR interval: look for pre-excitation syndromes.
- Long QT interval: investigate any predisposing factor as described later.
- Wide QRS complex: look for ventricular arrhythmia, conduction blocks, WPW syndrome etc.
Hypertrophy
Atrial enlargement is identified by examining the P wave, whereas Ventricular hypertrophy is determined by the QRS complex.
Right Atrial Enlargement
Tall P wave with normal duration, best seen in the lead II. It is also known as P pulmonale.
P wave height is > 2.5 small cells in the inferior leads. Right axis deviation of the P wave may be present (-ve P wave in lead I, +ve P wave in lead aVF).
Left Atrial Enlargement
Bifid or M shaped P wave in the lead II with prolonged duration, called P mitrale
Last part of P wave is > 1 small cell in duration. In V1 (biphasic P wave) the last part of P wave is > 1 small cell below iso-electric line.
Right Ventricular Hypertrophy
- Right axis deviation.
- In V1: R wave > S wave and In V6: R wave < S wave.
Normally R wave gradually increases from V1 to V6, this is known as R wave progression. This pattern is disrupted in case of Right Ventricular Hypertrophy.
Left Ventricular Hypertrophy
- Left axis deviation.
- (R wave in V5 or V6) + (S wave in V1 or V2) > 35 small cells
Ventricular Strain Pattern is often seen in case of ventricular hypertrophies. They are characterized by—
- Down sloping ST segment depression.
- T wave inversion.
They appear in V1, V2 in Right ventricular hypertrophy and in I, aVL, V5, V6 in Left ventricular hypertrophy.
Rhythm
Cardiac rhythm is best ascertained by looking at the long lead II.
Arrhythmia can be classified under three broad groups. Exclude them one by one.
- Ventricular arrhythmia
- Supra-ventricular arrhythmia
- Conduction blocks
They are explained below along with their sub-types.
Ventricular Arrhythmia
Ventricular arrhythmia is identified by wide and bizarre shaped QRS complex.
They are of 4 types—
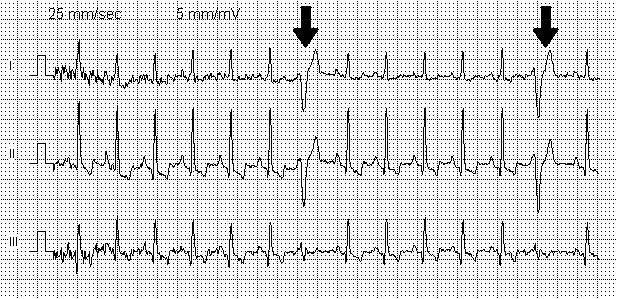
Premature Ventricular Contractions (PVC)
Appearance of wide and bizarre shaped QRS complex followed by a compensatory pause followed by normal resumption of beat. Usually they occur randomly but sometimes they may appear with alternate sinus beats regularly.
Accelerated Idioventricular Rhythm
Wide QRS complex without P wave. Heart rate is 50/min to 100/min (difference from VT, in which the rate is usually >120/min).
If the rate is below 50/min it is simply called Idioventricular Rhythm.
Ventricular Tachycardia (VT)
Consecutive appearance of wide and bizarre shaped QRS complex with a heart rate usually between 120/min 200/min. (By definition appearance of 3 or more PVC is called VT).
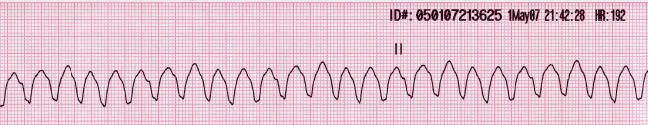
Torsades de pointes is a special type of ventricular tachycardia where the height of QRS complex varies periodically, so that it appears to rotate around an axis.
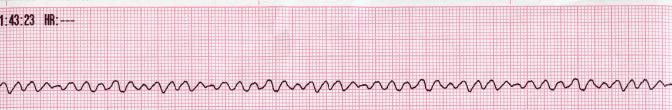
Ventricular Fibrillation (VF)
No identifiable QRS complex. The ECG tracing shows random deflections.
Supra-ventricular Arrhythmia
Supra-ventricular arrhythmia is differentiated from ventricular arrhythmia by presence of narrow QRS complex with normal morphology.
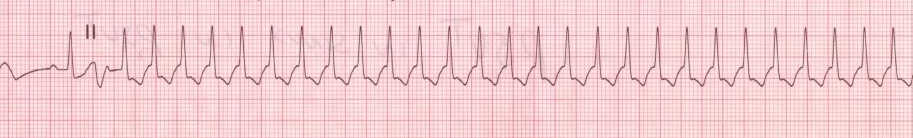
Sinus Tachycardia / Bradycardia
- Normal sinus rhythm.
- Tachycardia: Heart rate > 100.
- Bradycardia: Heart rate < 60.
Paroxysmal Supra-Ventricular Tachycardia (PSVT)
- No visible P wave. (Retrograde P wave is present, but they are usually buried within QRS complex, hence not visible.)
- Rhythm regular.
- Heart rate: 150/min - 250/min.
Atrial Flutter
- Saw-tooth shaped P waves.
- Rhythm regular.
- Atrial rate: 250/min - 350/min.
- Heart rate is lower due to AV block. Atrial rate:Heart rate is 2:1, 3:1, 4:1 etc.
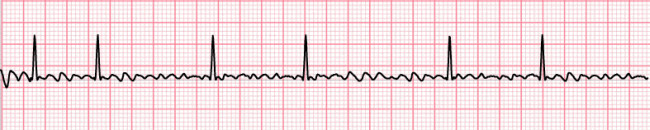
Atrial Fibrillation
- P waves appear as an undulating baseline.
- Rhythm irregular.
- Atrial rate: 350/min - 500/min.
- Heart rate is variable.
Multi-focal Atrial Tachycardia (MAT)
- At least 3 different morphology of P wave present.
- Rhythm irregular
- Heart rate: 100/min - 200/min
Paroxysmal Atrial Tachycardia (PAT)
- Similar to PSVT.
- Differentiated by carotid massage. Carotid massage terminates PSVT but PAT remains unaffected.
- On ECG PAT may show warm-up period (when the heart rate gradually increases) or cool-down period (when heart rate gradually decreases). No such feature present in PSVT.
Conduction blocks
They are of three main types, AV block, Bundle branch block and hemiblock.
AV block (Heart Block)
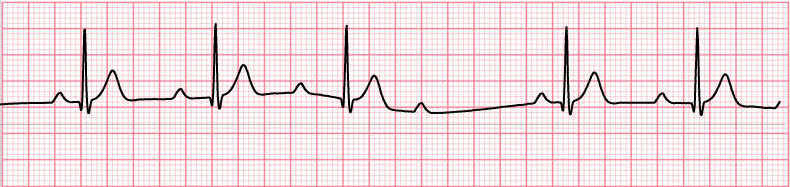
First degree AV block
Identification: Only PR interval is increased. No change in P wave or QRS complex.
Cause: Increased conduction delay in AV node.
Second degree AV block
Identification: Ratio of P:QRS is more than 1. E.g. 4:3, 3:2 etc.
Cause: In 2° AV block some of the P waves fail to pass through the AV node. The failed P waves doesn't give rise to any QRS complex causing this altered ratio.
Types: In addition to the above feature the PR interval may show some changes.
Most commonly PR interval gradually increases in each cycle, followed by a drop of QRS complex, then the PR interval resets to initial short length and again prolongs with each cycle. This type of AV block is known as Mobitz type I.
Less commonly the PR interval remains fixed and only drop of QRS complex is observed. This is known as Mobitz type II.
Third degree AV block
Identification: Complete dissociation of P and QRS, there is no correlation between them. P wave and QRS complex occurs at different rates.
Cause: No impulse can pass through the AV node. P wave appears at sinus rhythm and QRS complex at junctional rhythm.
Bundle branch block
It has two types, Right and Left. Both causes widening of the QRS complex. There is also a RSR' pattern (upstroke, down-stroke and upstroke again. Looks like a rabbit's ear) in the QRS complex. In RBBB RSR' appears in the right sided leads i.e. V1, V2 whereas in LBBB RSR' is present in left sided leads i.e. V5, V6, I, aVL.
Right Bundle Branch Block (RBBB)
- Wide QRS complex
- RSR' pattern in V1, V2
- Reciprocal changes in V5, V6, I, aVL
Left Bundle Branch Block (LBBB)
- Wide QRS complex
- RSR' pattern in V5, V6, I, aVL
- Reciprocal changes in V1, V2
Hemiblock
Hemiblock is of two types, Left Anterior and Left Posterior. In both cases QRS complex is NOT widened (difference with Bundle branch block). But both types are associated with axis deviation.
Left Anterior Hemiblock
Left axis deviation without any other cause.
Left Posterior Hemiblock
Right axis deviation without any other cause.
Mnemonic: RIP (Right is Posterior)
Bifascicular block
Right bundle branch block and hemiblock can occur at the same time, it is known as bifascicular block.
It is characterized by presence of features of both RBBB and hemiblock at the same time. Such as:
RBBB with Left Anterior hemiblock = (Wide QRS + RSR' in V1, V2) + (Left Axis Deviation)
RBBB with Left Posterior hemiblock = (Wide QRS + RSR' in V1, V2) + (Right Axis Deviation)
Summary of Arrhythmia
- First check QRS complex.
- If QRS complex is wide then look for ventricular arrhythmia.
- If QRS complex is narrow then look for supra-ventricular arrhythmia
- At last check if there is any conduction block present.
Pre-excitation Syndrome
Pre-excitation syndrome occurs when the impulse from SA node bypasses the AV nodal delay through an abnormal pathway and reaches the ventricles too early. They are identified by short PR interval. There are two common types—
Wolff-Parkinson-White Syndrome (WPW)
- Short PR interval.
- Wide QRS complex (difference from LGL syndrome).
- Sometimes delta waves may be seen, characterized by a slurred upstroke of the QRS complex.
Lown-Ganong-Levine Syndrome (LGL)
- Short PR interval.
- Normal QRS complex.
- No delta wave.
Pre-excitation syndrome often causes arrhythmias, most commonly PSVT and Atrial fibrillation.
Coronary Artery Disease
Myocardial Infarction
Myocardial infarction has different ECG pattern for three different stages of evolution.
Hyper-acute Myocardial Infarction
- ST segment elevation.
- Tall T wave.
Fully evolved Myocardial Infarction
- Appearance of Q waves.
- Elevated ST segment.
- T wave inversion.
Old Myocardial Infarction
All other features disappear except for the persistent Q wave.
Reciprocal Changes
These changes appear in the leads at the opposite side of the leads showing features of MI, i.e if lead I shows MI changes, lead aVR may show the reciprocal changes. Reciprocal changes include—
- ST segment depression. (reciprocal to ST elevation)
- Tall R wave. (reciprocal to deep Q wave)
Localizing the lesion
The ECG changes appear in the leads overlying the position of the lesion, whereas leads in opposite side shows reciprocal changes.
Depending on the leads showing the changes, the site of lesion can be determined as follows—
| MI changes in lead | Reciprocal changes in lead | Site of lesion | Vessel commonly involved |
|---|---|---|---|
| I, aVL, V5, V6 (Left lateral leads) | aVR, V1 (Right ventricular leads) | Left lateral wall of the heart | Left circumflex coronary artery |
| aVR, V1 (Right ventricular leads) | I, aVL, V5, V6 (Left lateral leads) | Right ventricle of the heart | Right coronary artery |
| II, III, aVF (Inferior leads) | - | Inferior wall of the heart | Right coronary artery |
| V2, V3, V4 (Anterior leads) | - | Anterior wall of the heart | Left Anterior Descending Artery |
| - | V2, V3, V4 (Anterior leads) | Posterior wall of the heart | Right coronary artery |
Not all myocardial infarction causes ST segment elevation. Depending on which they are divided into two types—
- ST segment elevated Myocardial Infarction (STEMI)
- Non ST segment elevated Myocardial Infarction (NSTEMI)
Angina
- ST segment elevation over affected area.
- Reciprocal changes in opposite leads i.e. ST segment depression.
- T wave inversion
Other common conditions causing ECG changes
Hyperkalemia
Hyperkalemia produces different changes with increasing levels of serum potassium.
-
Initially Tall peaked T wave.
(Difference with MI: in Myocardial Infarction T wave changes occur only in the leads overlying the lesion, but in hyperkalemia the changes are diffuse) -
With further increase, P-R interval prolongs.
T waves flattens and then disappears. -
Ultimately, QRS complex widens and merge with T wave to form sine wave pattern.
Ventricular fibrillation may develop.
Hypokalemia
- ST segment depression.
- T wave flattening.
- Appearance of U wave
Hypercalcemia
Short QT interval
Hypocalcemia
Prolonged QT interval
Hypothermia
- Sinus bradycardia.
- ST segment elevation with an abrupt up-slope followed by an abrupt down-slope. It is known as Osborn wave.
- Various arrhythmias.
- Muscle tremor artifact. (Not to be confused with atrial flutter)
Drugs
-
Digitalis
Therapeutic level of Digitalis may produce ST elevation and T inversion.
Digitalis Toxicity may cause sinus node suppression, conduction blocks and/or tachy-arrhythmias.
-
Drugs causing QT prolongation
Anti-arrhythmic drugs like quinidine, procainamide, amiodarone etc.
Other drugs include tricyclic anti-depressants, erythromycin, quinolone etc.
Prolong QT predisposes to arrhythmias. For more precise measurement QTc or corrected QT is used.
Pericarditis
ST elevation and T inversion. Changes appear diffusely in many leads (difference from MI).
In large effusion heart rotates freely causing variable voltage of QRS complex.
Hypertrophic Obstructive Cardiomyopathy
Left ventricular hypertrophy may be present. Q wave may be seen in lateral and inferior leads.
Myocarditis
Conduction blocks may be present.
Chronic Obstructive Pulmonary Disease
- Low voltage ECG.
- Right axis deviation.
- Right atrial enlargement (P pulmonale) and right ventricular hypertrophy may be present.
Pulmonary Embolism
- Right ventricular hypertrophy.
- S1Q3 pattern: Large S wave in lead I and deep Q wave in lead III.
- Arrhythmias may be present.
Cerebrovascular accident
- T wave inversion.
- Prominent U wave.
Conclusion
We have discussed the ECG interpretation in short. While it's a good way to get started with ECG, it's still a good idea to go through a standard book to understand ECG in a more detailed level.
 RSS Feed
Write a comment: